All Blogs
Use E-junkie and Google Sheets to Build a Real-Time Sales Dashboard
It's day two of your product launch. You've worked hard all year to create a fantastic product, test your sales systems and tell the world about this amazing offer. You know you've sold 100 products so far, but...
...you don't know whether your ads are effective, which affiliates are really killing it versus which have forgotten about your launch, or even whether your own emails are converting.
Looking at your E-junkie sales transaction log only, and having to decipher what's happened since the last time you looked, is like trying to drive in the dark without headlights.
Thankfully there is another way to track your sales, so you can see your data, get insights about what's working and what's not, and immediately act to increase your bottom line.
You can use a Google Sheet to capture E-junkie sales data automatically in real-time, and use the built-in charts to create an effective dashboard.
Using Apps Script, the scripting language used to extend Google Sheets, it’s possible to write a small program to capture data from E-junkie, so that every sale will immediately appear in your Google Sheet dashboard.
This post runs through the E-junkie integration in detail and then shows the concepts behind the Google Sheet dashboard (template available here).
Open up a new Google Sheet and in the code editor (Tools > Script editor...) clear out any existing code and add the following:
function doPost(e) {
var ss = SpreadsheetApp.getActiveSpreadsheet();
var sheet = ss.getSheetByName('Sheet1');
if (typeof e !== 'undefined') {
var data = JSON.stringify(e);
sheet.getRange(1,1).setValue(data);
return;
}
}
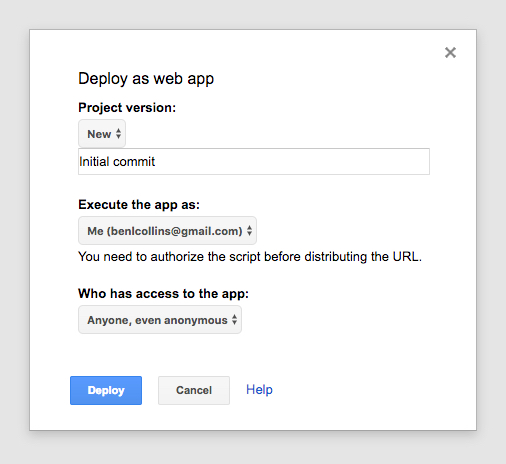
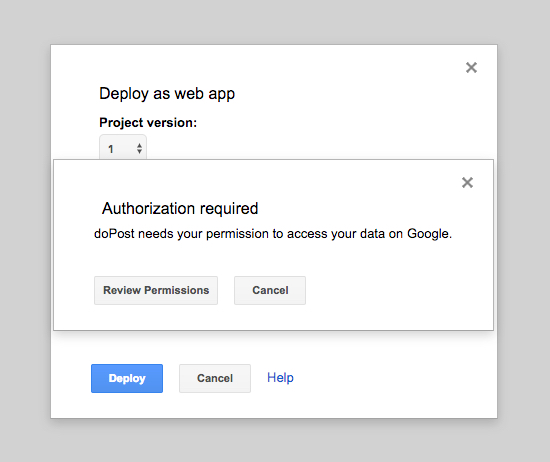
Save and publish it:
Publish > Deploy as a web app... and set the access to Anyone, even anonymous, as shown in this image:
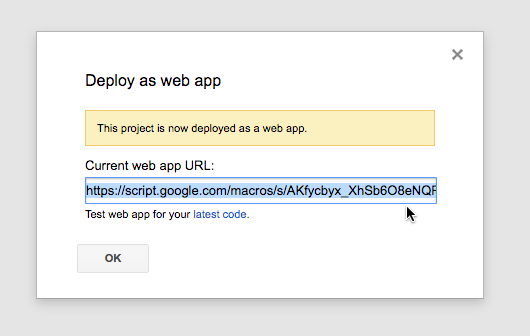
You'll be prompted to review permissions:
followed by:
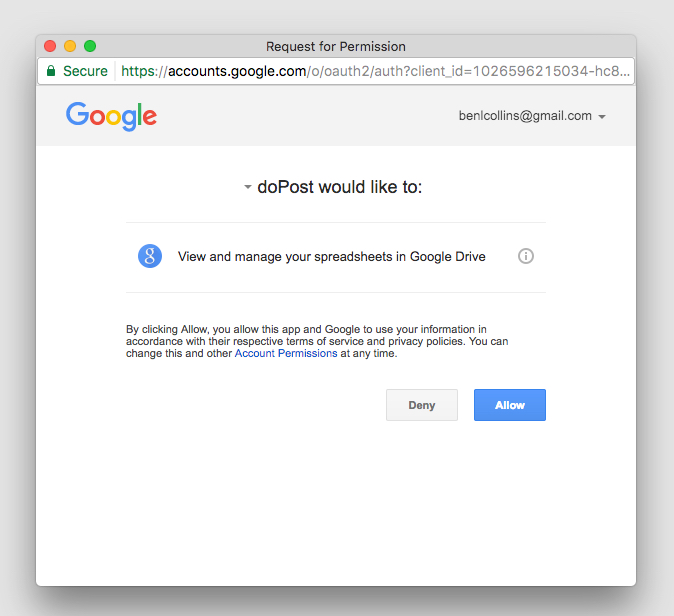
Click Allow. Copy the URL in the final deployment popup:
This is a one-time step the first time you publish to the web or run your script.
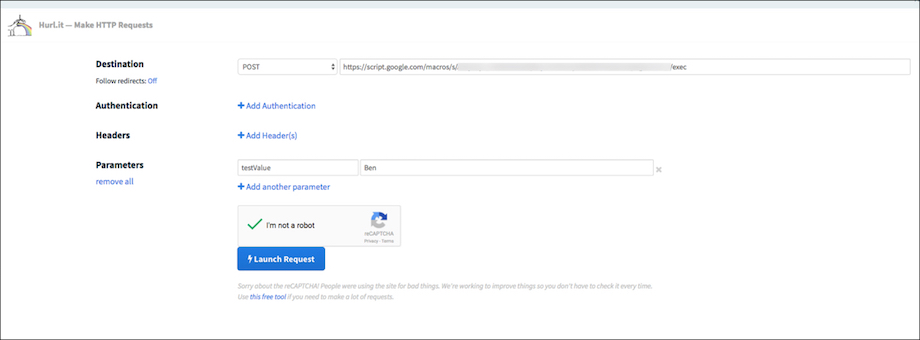
Now test this code by sending a POST request method to this Sheet's URL to see if it gets captured, using a service called hurl.it to send a test POST request.
Open hurl.it, select the POST option in the first dropdown menu, add the URL of your published sheet into the first text box and, for good measure, add a parameter, like this:
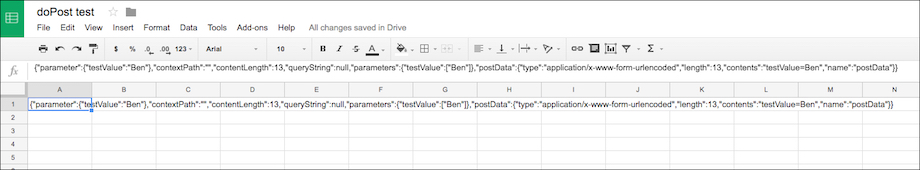
Click "Launch Request", head back to your Google Sheet and you should now see some data in cell A1 like this:
where the data is something like this:
{"parameter":{"testValue":"Ben"},"contextPath":"","contentLength":13,"queryString":null,"parameters":{"testValue":["Ben"]},"postData":{"type":"application/x-www-form-urlencoded","length":13,"contents":"testValue=Ben","name":"postData"}}
Voila! The data sent by the POST action is sitting pretty in your Google Sheet!
It's essentially exactly the same mechanics for the E-junkie data.
Make the following changes to the Sheet and the code to handle E-junkie data.
For the Sheet: Delete the data in cell A1, and add a row of headings that match the headings in lines 12 to 33 of the code below (omitting the data.):
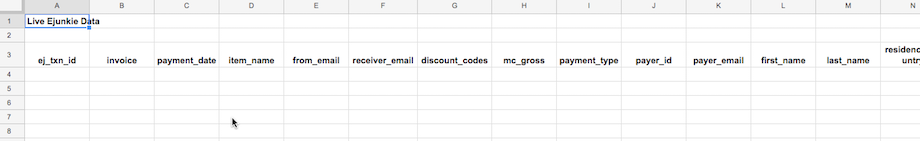
(This screenshot doesn't show all the columns, some are off-screen to the right.)
For the code: Delete all the previous code and replace with this (note that it refers to Sheet1, so if you've changed the name of your Sheet to something else you'll need to change it in the code on line 4 as well):
function doPost(e) {
var ss= SpreadsheetApp.openById("<Sheet ID>");
var sheet = ss.getSheetByName("Sheet1");
var outputArray = [];
if(typeof e !== 'undefined') {
var data = e.parameter;
outputArray.push(
data.ej_txn_id,
data.invoice,
data.payment_date,
data.item_name,
data.from_email,
data.receiver_email,
data.discount_codes,
data.mc_gross,
data.payment_type,
data.payer_id,
data.payer_email,
data.first_name,
data.last_name,
data.residence_country,
data.payer_status,
data.payment_status,
data.payment_gross,
data.affiliate_id,
data.item_affiliate_fee_total,
data.mc_currency,
data.payer_business_name,
data.payment_fee
);
sheet.appendRow(outputArray);
}
return;
}
Available on GitHub here.
Save your code and update the published web app (Publish > Deploy as a web app... and click Update).
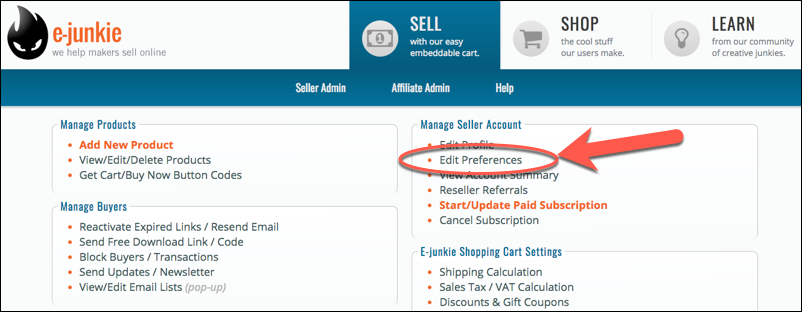
Copy this updated application URL to your clipboard. Log in to E-junkie and navigate to Edit Preferences:
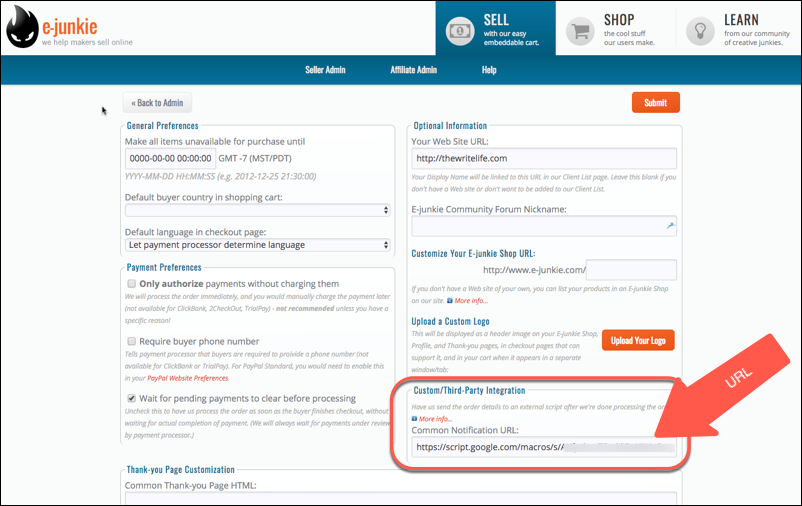
Paste in your URL into the Custom/Third-Party Integration Common Notification URL text box:
And that's it!
Whenever you make a sale through E-junkie, you should now see the data show up in your Sheet.
Read more details in the E-junkie integration documentation
To ensure everything updates in near real-time, change the calculation settings (File > Spreadsheet settings... > Calculation) for your Sheet to: On change and every minute
The revenue/profit chart is a standard bar chart showing total revenue and total profits against the target metrics (fictitious numbers):
Every one of these channels has their own row, showing the actual sales performance against that channel's projected sales:
The key formula driving this section of the dashboard is a simple COUNTIF formula, labeled 1 above, which counted the number of sales in the E-junkie dataset attributed to this channel:
=COUNTIF(e-junkie data , sales channel)
The sparkline formula for the green bar charts, labeled 2 above, is:
= SPARKLINE(value,{"charttype","bar";"max",MAX(values);"color1","green"}))
Ben Collins is a freelance spreadsheet developer and data analyst, helping businesses better understand their data through analytical insights and visualizations, including dashboards. He works primarily with Google Sheets and Apps Script and recently launched an online Google Sheets dashboard course. Find out more here:http://www.benlcollins.com.
...you don't know whether your ads are effective, which affiliates are really killing it versus which have forgotten about your launch, or even whether your own emails are converting.
Looking at your E-junkie sales transaction log only, and having to decipher what's happened since the last time you looked, is like trying to drive in the dark without headlights.
Thankfully there is another way to track your sales, so you can see your data, get insights about what's working and what's not, and immediately act to increase your bottom line.
You can use a Google Sheet to capture E-junkie sales data automatically in real-time, and use the built-in charts to create an effective dashboard.
Using Apps Script, the scripting language used to extend Google Sheets, it’s possible to write a small program to capture data from E-junkie, so that every sale will immediately appear in your Google Sheet dashboard.
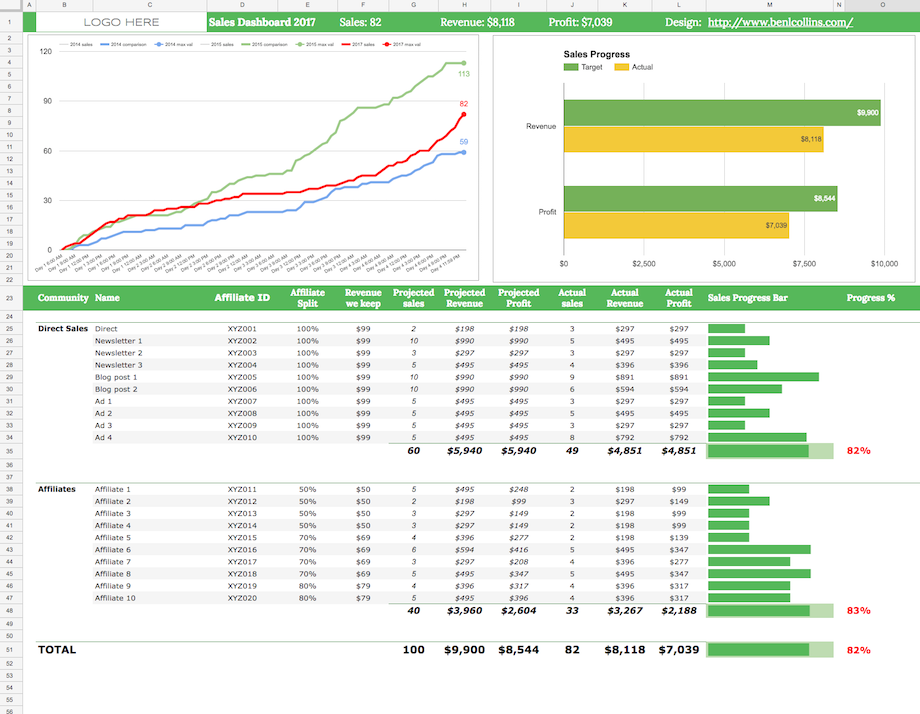
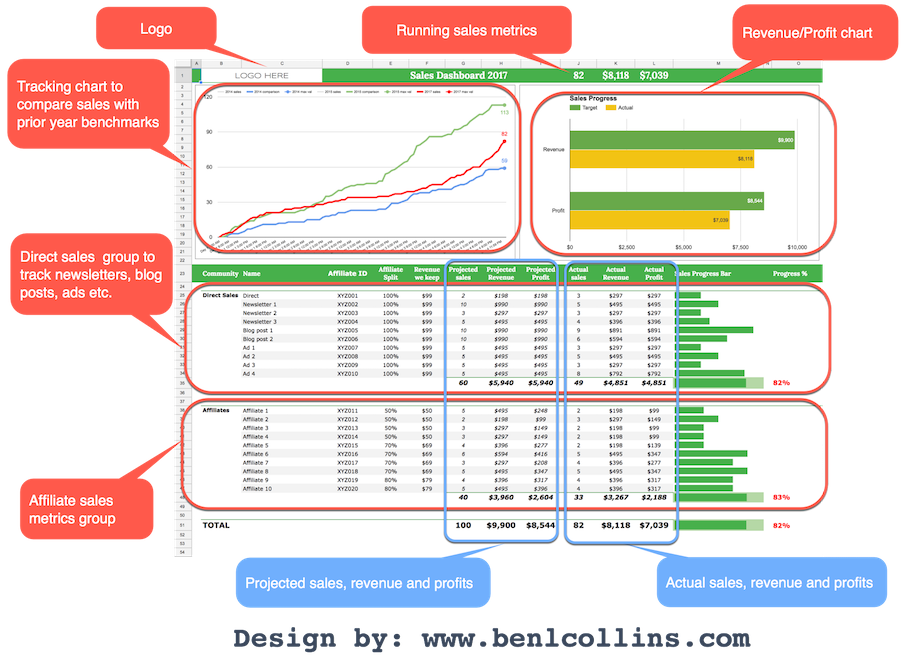
The real-time dashboard in Google Sheets
Here's the final dashboard, annotated to show the different sections:
This post runs through the E-junkie integration in detail and then shows the concepts behind the Google Sheet dashboard (template available here).
How to get data from E-junkie into Google Sheets
New to Apps Script? Check out this primer guide first.Open up a new Google Sheet and in the code editor (Tools > Script editor...) clear out any existing code and add the following:
function doPost(e) {
var ss = SpreadsheetApp.getActiveSpreadsheet();
var sheet = ss.getSheetByName('Sheet1');
if (typeof e !== 'undefined') {
var data = JSON.stringify(e);
sheet.getRange(1,1).setValue(data);
return;
}
}
Save and publish it:
Publish > Deploy as a web app... and set the access to Anyone, even anonymous, as shown in this image:
You'll be prompted to review permissions:
followed by:
Click Allow. Copy the URL in the final deployment popup:
This is a one-time step the first time you publish to the web or run your script.
Now test this code by sending a POST request method to this Sheet's URL to see if it gets captured, using a service called hurl.it to send a test POST request.
Open hurl.it, select the POST option in the first dropdown menu, add the URL of your published sheet into the first text box and, for good measure, add a parameter, like this:
Click "Launch Request", head back to your Google Sheet and you should now see some data in cell A1 like this:
where the data is something like this:
{"parameter":{"testValue":"Ben"},"contextPath":"","contentLength":13,"queryString":null,"parameters":{"testValue":["Ben"]},"postData":{"type":"application/x-www-form-urlencoded","length":13,"contents":"testValue=Ben","name":"postData"}}
Voila! The data sent by the POST action is sitting pretty in your Google Sheet!
It's essentially exactly the same mechanics for the E-junkie data.
Make the following changes to the Sheet and the code to handle E-junkie data.
For the Sheet: Delete the data in cell A1, and add a row of headings that match the headings in lines 12 to 33 of the code below (omitting the data.):
(This screenshot doesn't show all the columns, some are off-screen to the right.)
For the code: Delete all the previous code and replace with this (note that it refers to Sheet1, so if you've changed the name of your Sheet to something else you'll need to change it in the code on line 4 as well):
function doPost(e) {
var ss= SpreadsheetApp.openById("<Sheet ID>");
var sheet = ss.getSheetByName("Sheet1");
var outputArray = [];
if(typeof e !== 'undefined') {
var data = e.parameter;
outputArray.push(
data.ej_txn_id,
data.invoice,
data.payment_date,
data.item_name,
data.from_email,
data.receiver_email,
data.discount_codes,
data.mc_gross,
data.payment_type,
data.payer_id,
data.payer_email,
data.first_name,
data.last_name,
data.residence_country,
data.payer_status,
data.payment_status,
data.payment_gross,
data.affiliate_id,
data.item_affiliate_fee_total,
data.mc_currency,
data.payer_business_name,
data.payment_fee
);
sheet.appendRow(outputArray);
}
return;
}
Available on GitHub here.
Save your code and update the published web app (Publish > Deploy as a web app... and click Update).
Copy this updated application URL to your clipboard. Log in to E-junkie and navigate to Edit Preferences:
Paste in your URL into the Custom/Third-Party Integration Common Notification URL text box:
And that's it!
Whenever you make a sale through E-junkie, you should now see the data show up in your Sheet.
Read more details in the E-junkie integration documentation
The Google Sheets E-junkie dashboard
Really the crux of this whole example is getting the E-junkie data into your Google Sheet in real-time. Once you have that up and running, you're free to do anything you want with that data.To ensure everything updates in near real-time, change the calculation settings (File > Spreadsheet settings... > Calculation) for your Sheet to: On change and every minute
Example charts
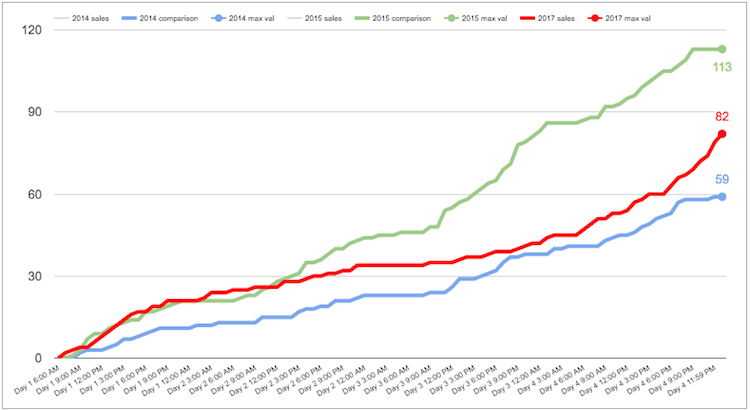
The line tracking chart, in the dashboard above, shows progress during the sale period, against the previous year benchmarks:
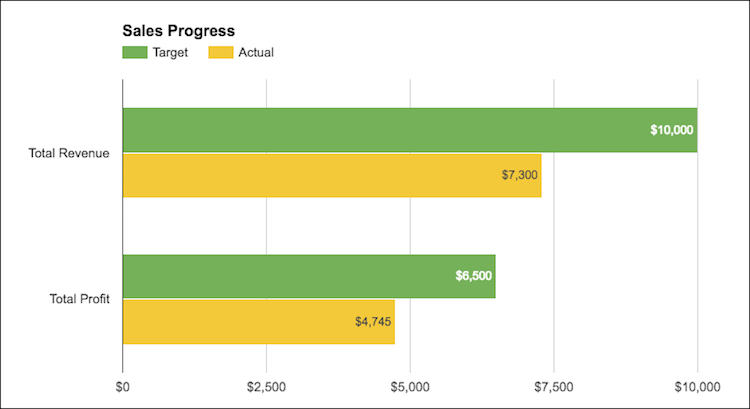
The revenue/profit chart is a standard bar chart showing total revenue and total profits against the target metrics (fictitious numbers):
Sales channel metrics
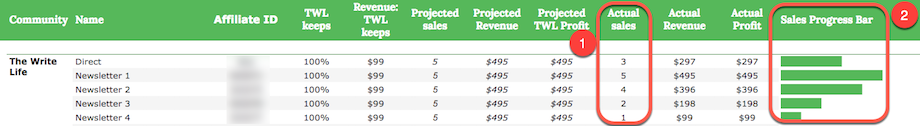
The lower portion of the dashboard is a breakout of all the different sales channels, everything from individual emails, to ads and different affiliates.Every one of these channels has their own row, showing the actual sales performance against that channel's projected sales:
The key formula driving this section of the dashboard is a simple COUNTIF formula, labeled 1 above, which counted the number of sales in the E-junkie dataset attributed to this channel:
=COUNTIF(e-junkie data , sales channel)
The sparkline formula for the green bar charts, labeled 2 above, is:
= SPARKLINE(value,{"charttype","bar";"max",MAX(values);"color1","green"}))
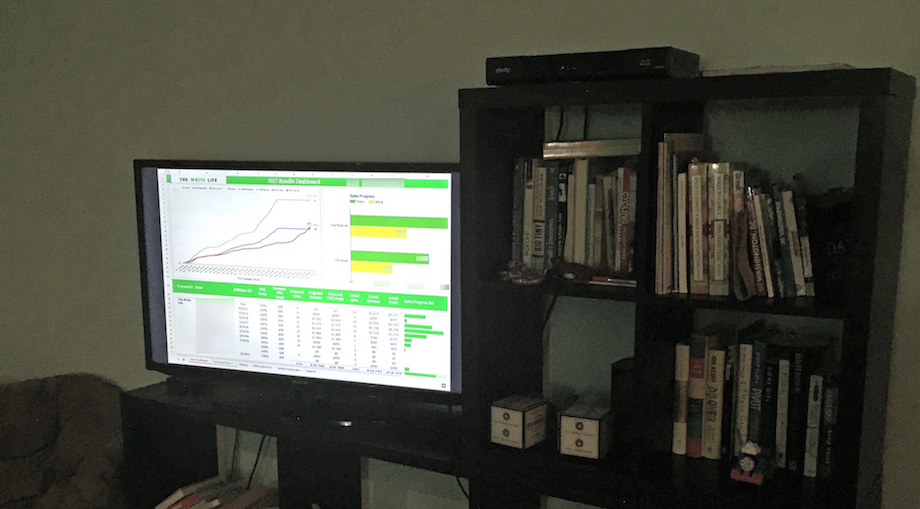
Big screen anyone?
For fun, why not try showing your dashboard full screen on a big TV to share with others:
Ben Collins is a freelance spreadsheet developer and data analyst, helping businesses better understand their data through analytical insights and visualizations, including dashboards. He works primarily with Google Sheets and Apps Script and recently launched an online Google Sheets dashboard course. Find out more here:http://www.benlcollins.com.